
Introduction
Most HR leaders have experienced some version of this problem: your voluntary turnover climbs to 18%, and you're not sure whether that's a crisis or just what happens in your industry. Your time-to-fill stretches to 52 days in engineering, and you don't know if that reflects a broken process or a genuinely competitive talent market.
Without external context, HR metrics are just numbers. They don't tell you whether to act, how urgently, or what a realistic improvement looks like.
HR benchmarking solves this by giving your data a frame of reference. It turns isolated metrics into signals you can act on.
According to McKinsey's 2023 State of Organizations report, organizations with strong people analytics capabilities saw an 80% increase in recruiting efficiency, a 25% rise in business productivity, and a 50% decrease in attrition rates. The difference between HR as a cost center and HR as a strategic function often comes down to whether leaders know what good looks like.
This guide covers what HR benchmarking is, which metrics matter most, how to run a complete benchmarking cycle, and where people leaders most commonly go wrong.
Key Takeaways
- HR benchmarking compares your people metrics against industry peers, internal teams, or best-in-class organizations to surface gaps and opportunities.
- Four types exist — internal, external, functional, and strategic — each suited to different questions.
- The most valuable benchmarks span hiring, turnover, engagement, compensation equity, and HR cost ratios.
- A structured process — from defining your focus area to monitoring outcomes — separates useful insight from data collection for its own sake.
- Benchmarking is ongoing — revisit it as your organization scales and market conditions shift.
What Is HR Benchmarking?
HR benchmarking is the systematic comparison of your organization's HR performance, practices, and metrics against a reference point. That reference could be industry standards, direct competitors, peer organizations, or your own historical data.
Two dimensions matter here:
- Quantitative benchmarking — numerical metrics like turnover rate, time-to-fill, cost-per-hire, and HR-to-employee ratio
- Qualitative benchmarking — non-numerical comparisons like onboarding quality, manager effectiveness, or culture practices
Effective benchmarking uses both. A 14% voluntary turnover rate tells you something. Exit interview themes and manager feedback tell you why — and that context is usually what drives the actual decision.
Types of HR Benchmarking
The four primary types serve different strategic questions:
| Type | What It Compares | Best Used For |
|---|---|---|
| Internal | Teams, departments, or regions within your org | Identifying performance variation at scale |
| External | Industry peers or direct competitors | Assessing competitiveness in the market |
| Functional | High-performing orgs outside your industry | Learning from best-in-class practices |
| Strategic | Your overall HR strategy vs. workforce trends | Aligning people priorities with business direction |
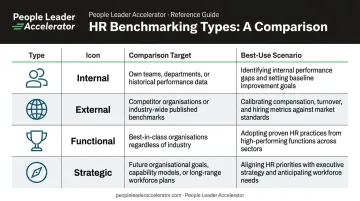
Choosing the right type starts with the question you're actually trying to answer. A company investigating why one region has higher attrition needs internal benchmarking; a company unsure whether their benefits package is competitive needs external data. Most organizations use more than one type simultaneously.
Why HR Benchmarking Is Critical for People Leaders
A 15% annual turnover rate means nothing in isolation. In retail, it might be well below average. In a specialized engineering function, it could signal a serious retention problem. Benchmarking provides the context that turns raw data into strategic direction.
This matters most when you're making the business case for investment. When you can show leadership that your cost-per-hire is 40% above industry median or your engagement score sits in the bottom quartile for your sector, you shift the conversation. The data does the persuading. Without comparable data, HR leaders end up advocating for programs on instinct alone — and that rarely moves budget.
For leaders in scaling organizations, this context is especially critical. SHRM's benchmarking toolkit notes that peer cuts by organization size and growth stage are among the most important comparison controls. What's acceptable at 50 employees can be a warning sign at 300.
The metrics themselves shift as hiring velocity increases, management layers deepen, and the informal culture mechanisms that worked early no longer scale.
High-growth companies in particular should benchmark frequently. First Round Capital's research on scaling organizations notes that companies undergo significant structural transitions starting around 30–50 employees. The reference data you used six months ago may already be outdated.
Three signals that it's time to re-benchmark:
- Headcount crossed a growth threshold (30, 100, or 300 employees)
- A major structural change occurred — new management layer, acquisition, or rapid hiring push
- A key metric has shifted more than 10–15% from your last baseline
Key HR Metrics to Benchmark
Not every metric is worth benchmarking. The selection criterion is simple: will this data inform a real decision? If moving this number wouldn't change what you do, it probably doesn't belong on your benchmarking list. Focus on 5–8 metrics directly tied to your current strategic priorities.
Talent Acquisition Metrics
These metrics reveal the health of your hiring engine:
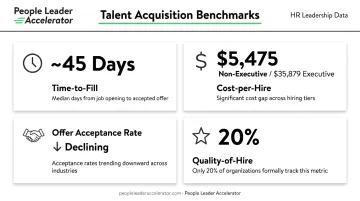
- Time-to-fill — Days from job opening to accepted offer. SHRM's 2025 recruiting report describes the current median as roughly 45 days, though this varies significantly by function and seniority.
- Cost-per-hire — SHRM's 2025 survey of 2,371 member organizations found an average of $5,475 for non-executive hires and $35,879 for executive hires.
- Offer acceptance rate — The percentage of offers accepted versus rejected (excluding outstanding offers per NACE's 2024 professional standards). A declining acceptance rate often signals a compensation or candidate experience problem before turnover data picks it up.
- Quality-of-hire — Only 20% of organizations currently track this, per SHRM 2025. It remains one of the most strategically important metrics — typically measured through performance reviews, retention, time-to-productivity, and hiring manager satisfaction.
Retention and Turnover Metrics
A single headline turnover number hides the variance that actually matters. Segment by:
- Job function and level — Engineering and executive attrition carry different cost and risk profiles than general staff turnover
- Tenure band — 0–12 month turnover indicates onboarding and early fit issues; 3–5 year turnover often points to career development gaps
- Manager-specific turnover — Persistent patterns at the team level are almost always a manager issue, not a compensation one
Current benchmarks to reference:
- Mercer's 2025 US Turnover Survey reports average annual voluntary turnover at 13.0% across industries
- BLS JOLTS data shows 2024 monthly quit rates ranging from 1.3% in information to 2.7% in retail trade — a useful cross-sector comparison
Employee Engagement and Productivity Metrics
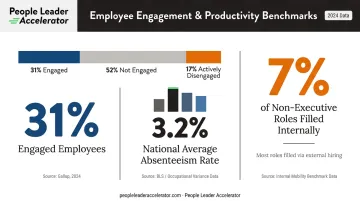
- Engagement scores — Gallup's 2024 data shows only 31% of U.S. employees are engaged, with 17% actively disengaged — a 10-year low. Use this as a baseline reference when assessing your own survey results.
- Absenteeism rate — BLS 2024 data puts the national average at 3.2% for full-time workers, with management occupations averaging 2.3% and healthcare support at 4.3%.
- Internal mobility rate — SHRM's 2025 data shows only 7% of non-executive positions are filled internally. High internal mobility is a strong proxy for career development health and leadership pipeline depth.
Compensation and HR Operations Metrics
HR-to-employee ratio — SHRM's 2025 benchmark is 1.98 HR employees per 100 workers at the median, rising to 2.78 per 100 in professional/scientific/technical services. Scaling companies often run leaner early, then face pressure to staff up as complexity grows.
HR cost as a percentage of operating expenses — SHRM 2025 median is 2.4%; Gartner's 2024 data (from a separate methodology) shows an average of 1.47%.
Compensation vs. market median — Market rates shift faster than most compensation cycles account for — sometimes meaningfully within 12–18 months. Refresh benchmarks at least annually for roles with active talent competition.
When presenting the HR cost figures to leadership, note the methodological difference between SHRM and Gartner data; both are useful directionally but not directly comparable.
The HR Benchmarking Process: Step by Step
Most organizations collect HR data. Few complete a full benchmarking cycle. What separates useful benchmarking from a reporting exercise is what happens after the data lands: the gap analysis, the response plan, and someone accountable for moving the number.
Step 1: Define the Focus Area and Guiding Question
Start by identifying the specific HR challenge. Work cross-functionally — the framing often improves when you bring in a business partner or finance colleague early.
Write a specific guiding question before collecting any data. For example: "How does our manager-level voluntary turnover compare to peers in our sector, and what compensation or development practices correlate with the difference?" A sharp question prevents benchmarking from sprawling into a data collection exercise with no clear output.
Step 2: Select the Right Metrics
Choose only the metrics that can directly answer your guiding question. The test: if you see movement in this number, what does it mean and what action follows? If you can't answer that, the metric probably doesn't belong on your list.
Prioritize 3–5 focused metrics over a broad dashboard. Benchmarking 20 metrics simultaneously guarantees that nothing gets acted on.
Step 3: Collect Internal and External Data
Internal sources:
- HRIS and payroll system exports
- Engagement survey results
- Exit interview data
- Performance review aggregates
External sources:
- SHRM benchmarking reports (88 data sets with cuts by industry, size, and region)
- BLS JOLTS and CPS data (public, updated monthly)
- Mercer, Aon Radford McLagan, and Culpepper for compensation data
- Professional networks and peer HR communities for qualitative context
One critical data quality step: Standardize definitions before comparing. "Turnover" and "attrition" are used interchangeably inside many organizations but defined differently across sources. BLS "quits" excludes retirements and internal transfers; SHRM quality-of-hire has no universal formula. Align on terminology before running comparisons.
Step 4: Analyze Gaps and Prioritize
Flag gaps large enough to indicate a structural issue or competitive risk — not every deviation from the median warrants action. A longer time-to-fill might reflect higher hiring standards that produce better retention downstream, not a broken recruiting process.
Rank gaps by two factors: the magnitude of the deviation and the business consequence of leaving it unaddressed. That prioritization should drive where you focus next.
Step 5: Design and Implement a Response Plan
Every initiative needs:
- A named owner
- Executive sponsorship
- Measurable milestones with a timeline
- A defined way to track progress
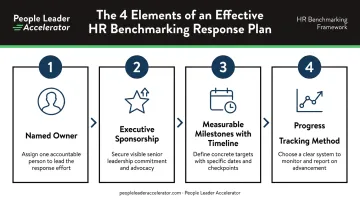
If the plan can't answer "who owns this and how will we know it's working," it needs more work before it goes to leadership. That clarity is what separates initiatives that move benchmarks from ones that expire quietly in a slide deck.
Step 6: Monitor Progress and Revisit Benchmarks
Schedule structured check-ins — quarterly for active initiatives, semi-annually for broader metric health. When presenting results to leadership, lead with the narrative: what changed, why it changed, and what the next threshold looks like. Don't just report numbers.
Revisit the benchmark reference data at least annually. In high-growth environments, your own workforce profile changes fast enough that last year's baseline may already be misleading.
HR Benchmarking Best Practices and Common Pitfalls
Best Practices
- Match comparison organizations carefully — industry, size, geography, and growth stage all matter. A Series B startup benchmarking against Fortune 500 averages will draw misleading conclusions. Gartner's 2024 HR budget benchmarking guidance specifically notes that peer context is essential for valid external comparison.
- Use your professional network — Peer HR communities and alumni networks often provide qualitative context that formal data sources can't: what practices are actually working, what interventions failed, what tradeoffs others have made.
- Set phased goals — Don't try to close every gap at once. Sequence initiatives by impact and feasibility.
- Protect data privacy — Anonymize sources and follow established benchmarking codes of conduct when sharing or receiving peer data.
Common Pitfalls
Even well-intentioned benchmarking efforts can mislead if you're not careful. Watch for these three patterns:
- Treating benchmarks as targets. If your turnover is 5% above the industry median, the goal isn't to hit the median. The goal is to understand why the gap exists and whether closing it would actually improve business outcomes. Benchmarks are directional signals — they tell you where to investigate, not what to copy.
- Comparing against the wrong peer group. A 150-person Series B company benchmarking against a 5,000-person mature enterprise will find the results largely irrelevant. HR-to-employee ratios, comp structures, and turnover norms look different at different growth stages. The better comparison is organizations at a similar headcount, growth trajectory, and organizational complexity. Peer networks are often the best source for this type of peer-level data.
- Relying only on quantitative data. Survey scores, exit interview themes, and manager feedback reveal the why behind a gap. A turnover number tells you something is wrong. The qualitative layer tells you what to actually fix.
How People Leader Accelerator Can Help
For HR leaders who want to benchmark well and translate the findings into action, the skill set matters as much as the data access.
People Leader Accelerator is built specifically for this. Faculty members Marie Szuts, who led the people function at Figma through rapid scaling, and Andrew Bartlow, co-author of Scaling for Success: People Priorities for High Growth Organizations and a former private equity operating partner, bring direct experience with benchmarking challenges in growth-stage organizations — not enterprise HR theory.
PLA's relevant resources include:
- Compensation Benchmarking & Leveling Guide — covers compensation philosophy, survey source selection, job leveling, and market alignment
- People Analytics Full Guide — walks through identifying high-value metrics, building an HR dashboard, and using data to influence decisions
- PLA Mastermind — a monthly peer forum of 8–12 senior HR leaders at comparable organizations, where informal benchmarking happens through curated peer exposure and live decision-making conversations
Beyond the structured resources, the PLA alumni community — hundreds of HR professionals across industries — extends that peer access through a private Slack community, monthly workshops, and an annual retreat.
If you're building a more structured benchmarking capability, the Compensation Benchmarking & Leveling Guide and People Analytics Full Guide are the clearest entry points.
Frequently Asked Questions
What is benchmarking for HR?
HR benchmarking is the process of comparing your organization's HR practices and metrics against industry peers, competitors, or your own historical data to identify gaps, set realistic goals, and make more informed people decisions. It provides the external context that makes internal metrics meaningful.
What are the 5 key HR metrics?
The five most commonly benchmarked metrics are voluntary turnover rate, time-to-fill, cost-per-hire, employee engagement score, and HR-to-employee ratio. The most relevant ones for your organization depend on your current strategic priorities and growth stage — there's no single universal list.
What are the 4 stages of benchmarking?
The four core stages are: (1) define the focus area and select metrics, (2) collect and standardize internal and external data, (3) analyze gaps and identify improvement priorities, and (4) implement changes with clear ownership and monitor results over time.
What is the difference between internal and external HR benchmarking?
Internal benchmarking compares performance across teams, departments, or regions within your organization. External benchmarking measures your HR metrics against industry peers or competitors. Both serve distinct purposes — internal benchmarking surfaces internal variation; external benchmarking assesses market competitiveness.
How often should HR benchmarking be conducted?
Most organizations should review key benchmarks at least annually, with quarterly check-ins for metrics tied to active improvement initiatives. High-growth organizations should refresh more frequently. Their workforce profile and competitive context shift fast enough that annual cycles can miss critical inflection points.
What are the biggest challenges in HR benchmarking?
The main challenges are inconsistent metric definitions that make direct comparison difficult, and limited access to reliable external data (much of it sits behind membership or purchase paywalls). There's also the risk of treating benchmarks as rigid targets rather than directional signals that require contextual interpretation.