
Introduction
Talent retention is the number one HR priority for 59% of HR leaders in 2025, according to Gallagher's U.S. Workforce Trends Report. And yet, Gallup research found that 42% of voluntary turnover is preventable — meaning employees who left believed their manager or organization could have done something to keep them.
That gap between what's preventable and what actually gets prevented is often a measurement problem. Organizations that don't track turnover rigorously can't identify who's leaving, when, or why — which means retention efforts end up reactive rather than strategic.
This guide gives HR leaders the tools to close that gap. Here's what's covered:
- How to define and calculate employee turnover rate accurately
- How to interpret your numbers against industry benchmarks
- What high turnover actually costs the organization
- What's driving attrition in most workplaces today
Key Takeaways
- Employee turnover rate measures the percentage of employees who leave within a set period — segment it by type, department, and tenure for meaningful insight
- The standard formula: (Terminations ÷ Employees at Start of Period) × 100
- Industry benchmarks vary significantly — accommodation and food services runs at 5.5% monthly vs. 1.5% for government
- Replacement costs range from 40% of salary for frontline roles to 200% for managers and leaders
- 70% of preventable exits tie back to management issues, making manager effectiveness the highest-leverage retention factor
What Is Employee Turnover Rate? Definition and Key Types
Employee turnover rate is the percentage of employees who permanently leave an organization within a defined timeframe — typically measured monthly, quarterly, or annually. It covers both voluntary and involuntary exits from the organization's payroll.
What it excludes matters just as much as what it includes:
- Internal transfers or promotions within the same company
- Employees on paid or unpaid leave
- Temporary furloughs where the employment relationship remains intact
Tracking only the headline number misses critical context. The type of departure tells you far more than the count.
Voluntary vs. Involuntary Turnover
Voluntary turnover is employee-initiated — resignations, early retirements, and departures for other opportunities. For HR leaders, it's the most strategically actionable category — because it typically reflects dissatisfaction with management, culture, compensation, or growth opportunities, and those are levers you can pull.
Involuntary turnover is employer-initiated: layoffs, terminations for performance, and misconduct-related exits. Some of this is healthy — removing chronic underperformers raises the bar for the whole team. Persistent patterns, though, often point to upstream failures in hiring or onboarding rather than individual performance issues.
Internal vs. External Turnover
Internal turnover refers to employees moving to different roles or departments within the same organization. It's generally a positive signal — one that suggests career growth pathways exist and are actively being used.
External turnover is what most metrics track: employees leaving the organization entirely. It's also where the business impact concentrates — in lost productivity, replacement costs, and institutional knowledge walking out the door. When this guide refers to "turnover rate," it means external departures.
How to Calculate Employee Turnover Rate
For internal tracking, the most reliable approach divides terminations during a period by headcount at the start of that period. New hires are excluded from the denominator and tracked in a separate new-hire turnover calculation. (Note: SHRM uses an average-headcount denominator; BLS tracks establishment-level separations — both valid for benchmarking, but harder to apply consistently internally.)
The Step-by-Step Formula
You need three inputs:
- Number of employees at the start of the period
- Number of employees who left during the period
- The timeframe (monthly, quarterly, or annual)
The formula:
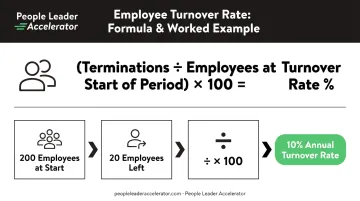
(Number of Terminations ÷ Number of Employees at Start of Period) × 100 = Turnover Rate %
Worked example:
- 200 employees at the start of the year
- 20 employees leave during the year
- 20 ÷ 200 × 100 = 10% annual turnover rate
Calculating Monthly and Departmental Turnover
The same formula applies for monthly calculations, useful for spotting seasonal spikes, post-restructuring trends, or the impact of a leadership change. Divide monthly departures by headcount at the start of that month.
The more diagnostic step is segmentation. Breaking down turnover by department, tenure band, role level, and manager exposes patterns that company-wide numbers hide. A 9% overall rate looks manageable until you discover 80% of departures are coming from one team or one manager's direct reports.
Segmentation approaches worth building into your process:
- Track exits by department to surface team-level retention risks before they escalate
- Analyze by tenure band to catch early-tenure loss, especially in the first 12 months
- Separate role levels to distinguish frontline attrition from leadership exits (they require different responses)
- Cut by manager — this is often the most revealing analysis available to HR
One practical note: consistency matters more than formula precision. Pick one method and apply it uniformly over time, or your trend comparisons become unreliable.
How to Interpret Your Turnover Rate: Benchmarks and Context
A raw turnover number is only useful against comparison points. Interpretation requires three reference frames: your own historical trend, industry benchmarks, and the quality of departures — not just the quantity.
Industry Benchmarks to Know
The Bureau of Labor Statistics 2025 annual-average separation rates show significant variation across sectors:
| Industry | Annual-Average Monthly Separation Rate |
|---|---|
| Accommodation & food services | 5.5% |
| Retail trade | 3.8% |
| Total nonfarm (all industries) | 3.3% |
| Health care & social assistance | 2.9% |
| Finance & insurance | 2.1% |
| Government | 1.5% |
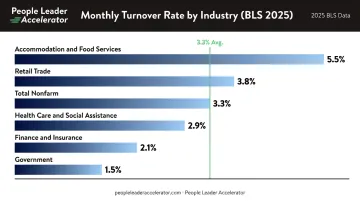
Keep in mind these are monthly rates — organizations measuring annual turnover should benchmark against their specific industry, not the overall average.
SHRM's guidance suggests targeting below 10% annually as a reasonable threshold for many industries — though this varies by sector. A 10% rate in government warrants concern; a 10% rate in hospitality is exceptional performance.
Functional vs. Dysfunctional Turnover
Not all departures hurt equally. HR leaders should track who is leaving, not just how many.
Functional turnover — losing chronic underperformers, enabling internal mobility, or refreshing stagnant teams — can improve organizational health.
Dysfunctional turnover — losing high performers, subject matter experts, or institutional knowledge holders — is where business damage concentrates.
When top performers start leaving, it's often both symptom and catalyst: their departure increases workload on remaining staff and signals to others that the organization may not be worth staying in.
The practical implication: build exit tracking that captures performance tier of departing employees, not just headcount.
The Business Impact of High Employee Turnover
A single departure carries a defined price tag. Sustained high turnover multiplies that cost across recruitment, productivity loss, and team stability — and the damage compounds faster than most organizations track.
The Direct Costs of Replacing Employees
Gallup's 2026 estimates offer the clearest role-stratified breakdown available:
| Employee Level | Estimated Replacement Cost |
|---|---|
| Frontline employee | 40% of annual salary |
| Technical professional | 80% of annual salary |
| Manager or leader | 200% of annual salary |
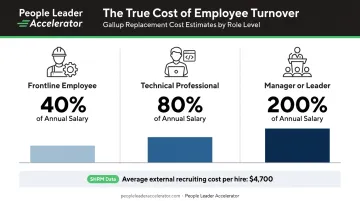
SHRM separately reports an average recruiting cost of nearly $4,700 per hire — and that's before accounting for onboarding, training, or productivity ramp-up time. Gallup also notes that most employees take 12 or more months to become fully effective in a new role.
Hard costs typically include:
- Recruiting fees and job advertising
- Background screening and assessments
- Onboarding materials and training program delivery
Soft costs — harder to quantify, equally real:
- Lost productivity during the vacancy period
- Manager time spent interviewing and onboarding
- Team disruption while the role is unfilled
- Lower output from the new hire during their ramp period
Downstream Organizational Effects
Beyond the per-exit cost, sustained high turnover creates compounding organizational risk:
Morale erodes under added load. Remaining employees absorb the workload of open roles, increasing stress and burnout risk. Research confirms that turnover independently raises workplace demands on coworkers — separate from any budget or staffing decisions.
High-visibility exits trigger more exits. Watching colleagues leave prompts others to reassess their own options. When respected performers walk out, it signals to everyone else that leaving is both acceptable and achievable — a contagion effect that's difficult to interrupt once it starts.
Employer brand damage raises the cost of every future hire. Organizations with a reputation for churn pay a premium to attract candidates, or struggle to attract competitive talent at all. For high-growth companies where talent density directly drives business outcomes, that dynamic can lock in a sustained recruitment disadvantage.
Common Root Causes of Employee Turnover
Gallup's research offers a useful framing: among preventable voluntary exits, 70% involved management-related issues — poor interactions, lack of advancement, or feeling unsupported — while 30% involved compensation. That split shapes where retention investment is likely to have the most impact.
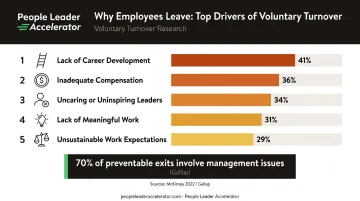
McKinsey's 2022 survey of over 13,000 employees across six countries identified the leading quit drivers:
- Lack of career development and advancement — 41% of voluntary leavers
- Inadequate compensation — 36%
- Uncaring or uninspiring leaders — 34%
- Lack of meaningful work — 31%
- Unsustainable work expectations — 29%
That "uncaring leaders" driver at 34% aligns with a consistent finding across research: DDI data shows 57% of employees had left a job specifically because of their manager, with another 32% having seriously considered it. Gallup, McKinsey, and DDI all point to the same pressure point.
Diagnosing your organization's specific drivers requires more than reading industry research. The most effective approach combines:
- Exit interview data — what people say when they leave
- Stay interviews — what's keeping people before they leave
- Engagement pulse surveys — ongoing early warning signals
Segmenting that data by department and tenure reveals whether the problem is systemic or isolated — high early-tenure exits often signal onboarding gaps, while mid-tenure departures more commonly point to advancement ceilings or manager relationships.
How to Reduce Employee Turnover: Strategies for HR Leaders
Retention strategy that starts at resignation is already too late. The most effective interventions happen earlier — often much earlier.
Hire for Fit, Not Just Skills
Assessing candidates for cultural alignment alongside skill fit reduces early-tenure turnover, which accounts for a disproportionate share of overall departures. SHRM research found that 53% of HR professionals identified the first year as the most difficult retention period.
Target Your Highest-Leverage Retention Levers
Use segmented turnover data to identify where you're losing people most — then prioritize accordingly:
- Benchmark compensation to market rates, especially if pay dissatisfaction surfaces frequently in exit data
- Invest in manager development first: management issues appear in 70% of preventable exits, making it the highest-ROI retention lever for most organizations
- Build clear career pathways and internal mobility programs — lack of development is the leading quit driver in McKinsey's research
- Establish regular recognition practices, which are low-cost and frequently underutilized
- Offer flexible work arrangements, now a baseline expectation rather than a differentiator
Build Proactive Systems, Not Reactive Fixes
Organizations with the strongest retention don't wait for exit interviews. They use stay interviews to surface dissatisfaction before it becomes resignation, people analytics dashboards to track turnover trends by segment in real time, and structured offboarding to capture learning from every departure.
For HR professionals building these capabilities, People Leader Accelerator offers a free Cost of Turnover Calculation Template and a comprehensive People Analytics Guide to help translate workforce data into targeted retention decisions.
Frequently Asked Questions
What is the turnover rate in HR?
Employee turnover rate is the percentage of employees who permanently leave an organization within a set period — monthly, quarterly, or annually. It's a core workforce stability metric used to assess retention strategy effectiveness and can be calculated at the company, department, or team level.
Is a 20% employee turnover rate high?
For most industries, yes — 20% is roughly double the ~10% annual rate SHRM considers a reasonable target. Context matters: in hospitality or retail it may be closer to average, while in professional services or technology it signals a retention problem worth investigating immediately.
Is a 5% employee turnover rate good?
Generally, yes. A 5% annual rate falls within the healthy range for most industries and indicates strong retention. HR leaders should still verify it against their specific industry benchmark and confirm the low rate isn't masking stagnation or a lack of fresh talent entering the organization.
What is the difference between voluntary and involuntary turnover?
Voluntary turnover is employee-initiated (resignations, retirements) and often reflects dissatisfaction or better opportunities elsewhere. Involuntary turnover is employer-initiated (layoffs, terminations). Tracking both separately matters because they have different root causes and require different responses.
How often should organizations calculate their turnover rate?
Most organizations report annually for trend comparison, but monthly or quarterly tracking catches early warning signals — especially after restructuring, leadership transitions, or compensation changes. Department-level calculations should run on a consistent cadence regardless of company-wide reporting frequency.
What does it cost to replace an employee?
Gallup estimates replacement costs at 40% of annual salary for frontline roles, 80% for technical professionals, and 200% for managers and leaders. These figures make a direct business case for retention investment — even a modest reduction in turnover among high-cost roles typically funds most retention programs outright.